Memphis & Shelby County Foreclosure Statistics
Jump to: filings · auction sales · who buys · prices · ZIP codes · trustee firms · tax sale · quarterly reports · cite or reuse · download the data
Key takeaways — Q3 2026
- 367 new foreclosure filings in Shelby County (35.4% above a year earlier — the most of any quarter since at least January 2025)
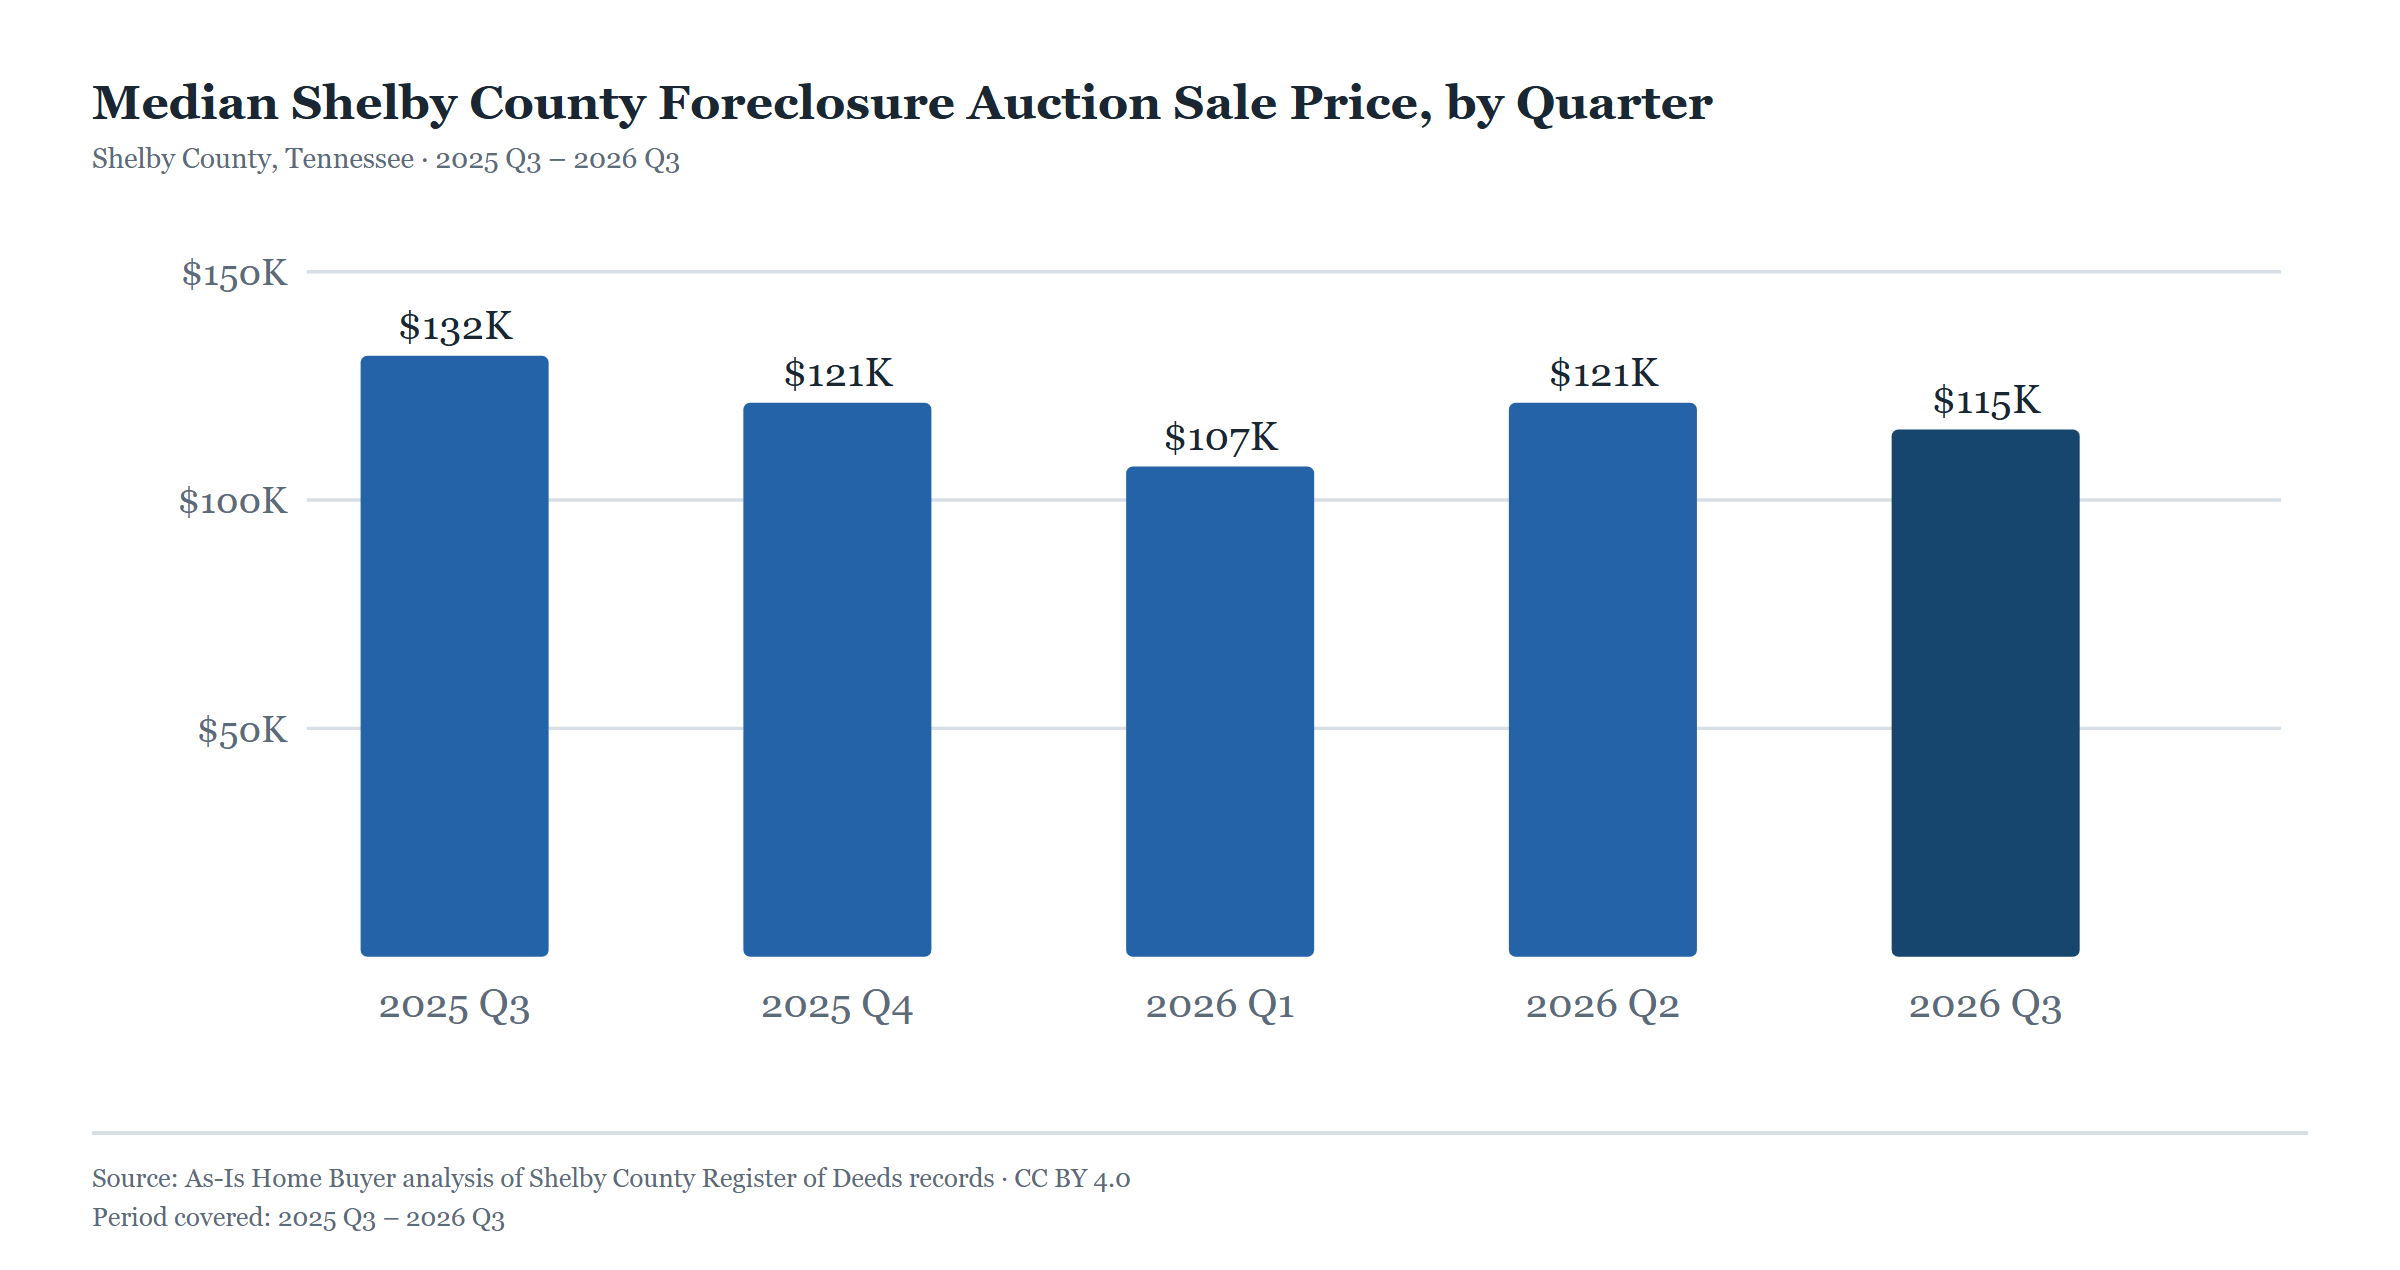
- 157 homes completed foreclosure at auction; median sale price $115,106 vs. about $187,000 (Redfin, three months ending August 2026) citywide
- Lender- and government-type buyers took 51% of auctioned homes, the largest share in five quarters; investment entities bought 25%, the smallest
- 1,266 parcels on the county tax-sale list, all assigned to Tax Sale 2302 (April 13, 2027); Tax Sale 2301 is scheduled for October 27, 2026
- Every figure is free to republish with a link to this page (terms)
This page is the running statistical record of residential foreclosure in Memphis and Shelby County, Tennessee, maintained by the team behind the quarterly Shelby County Foreclosure Report. Every number is computed from Shelby County Register of Deeds or County Trustee public records — not modeled, not estimated (methodology). It is refreshed each quarter when the new report publishes; this URL is permanent.
How many foreclosures are filed in Shelby County?
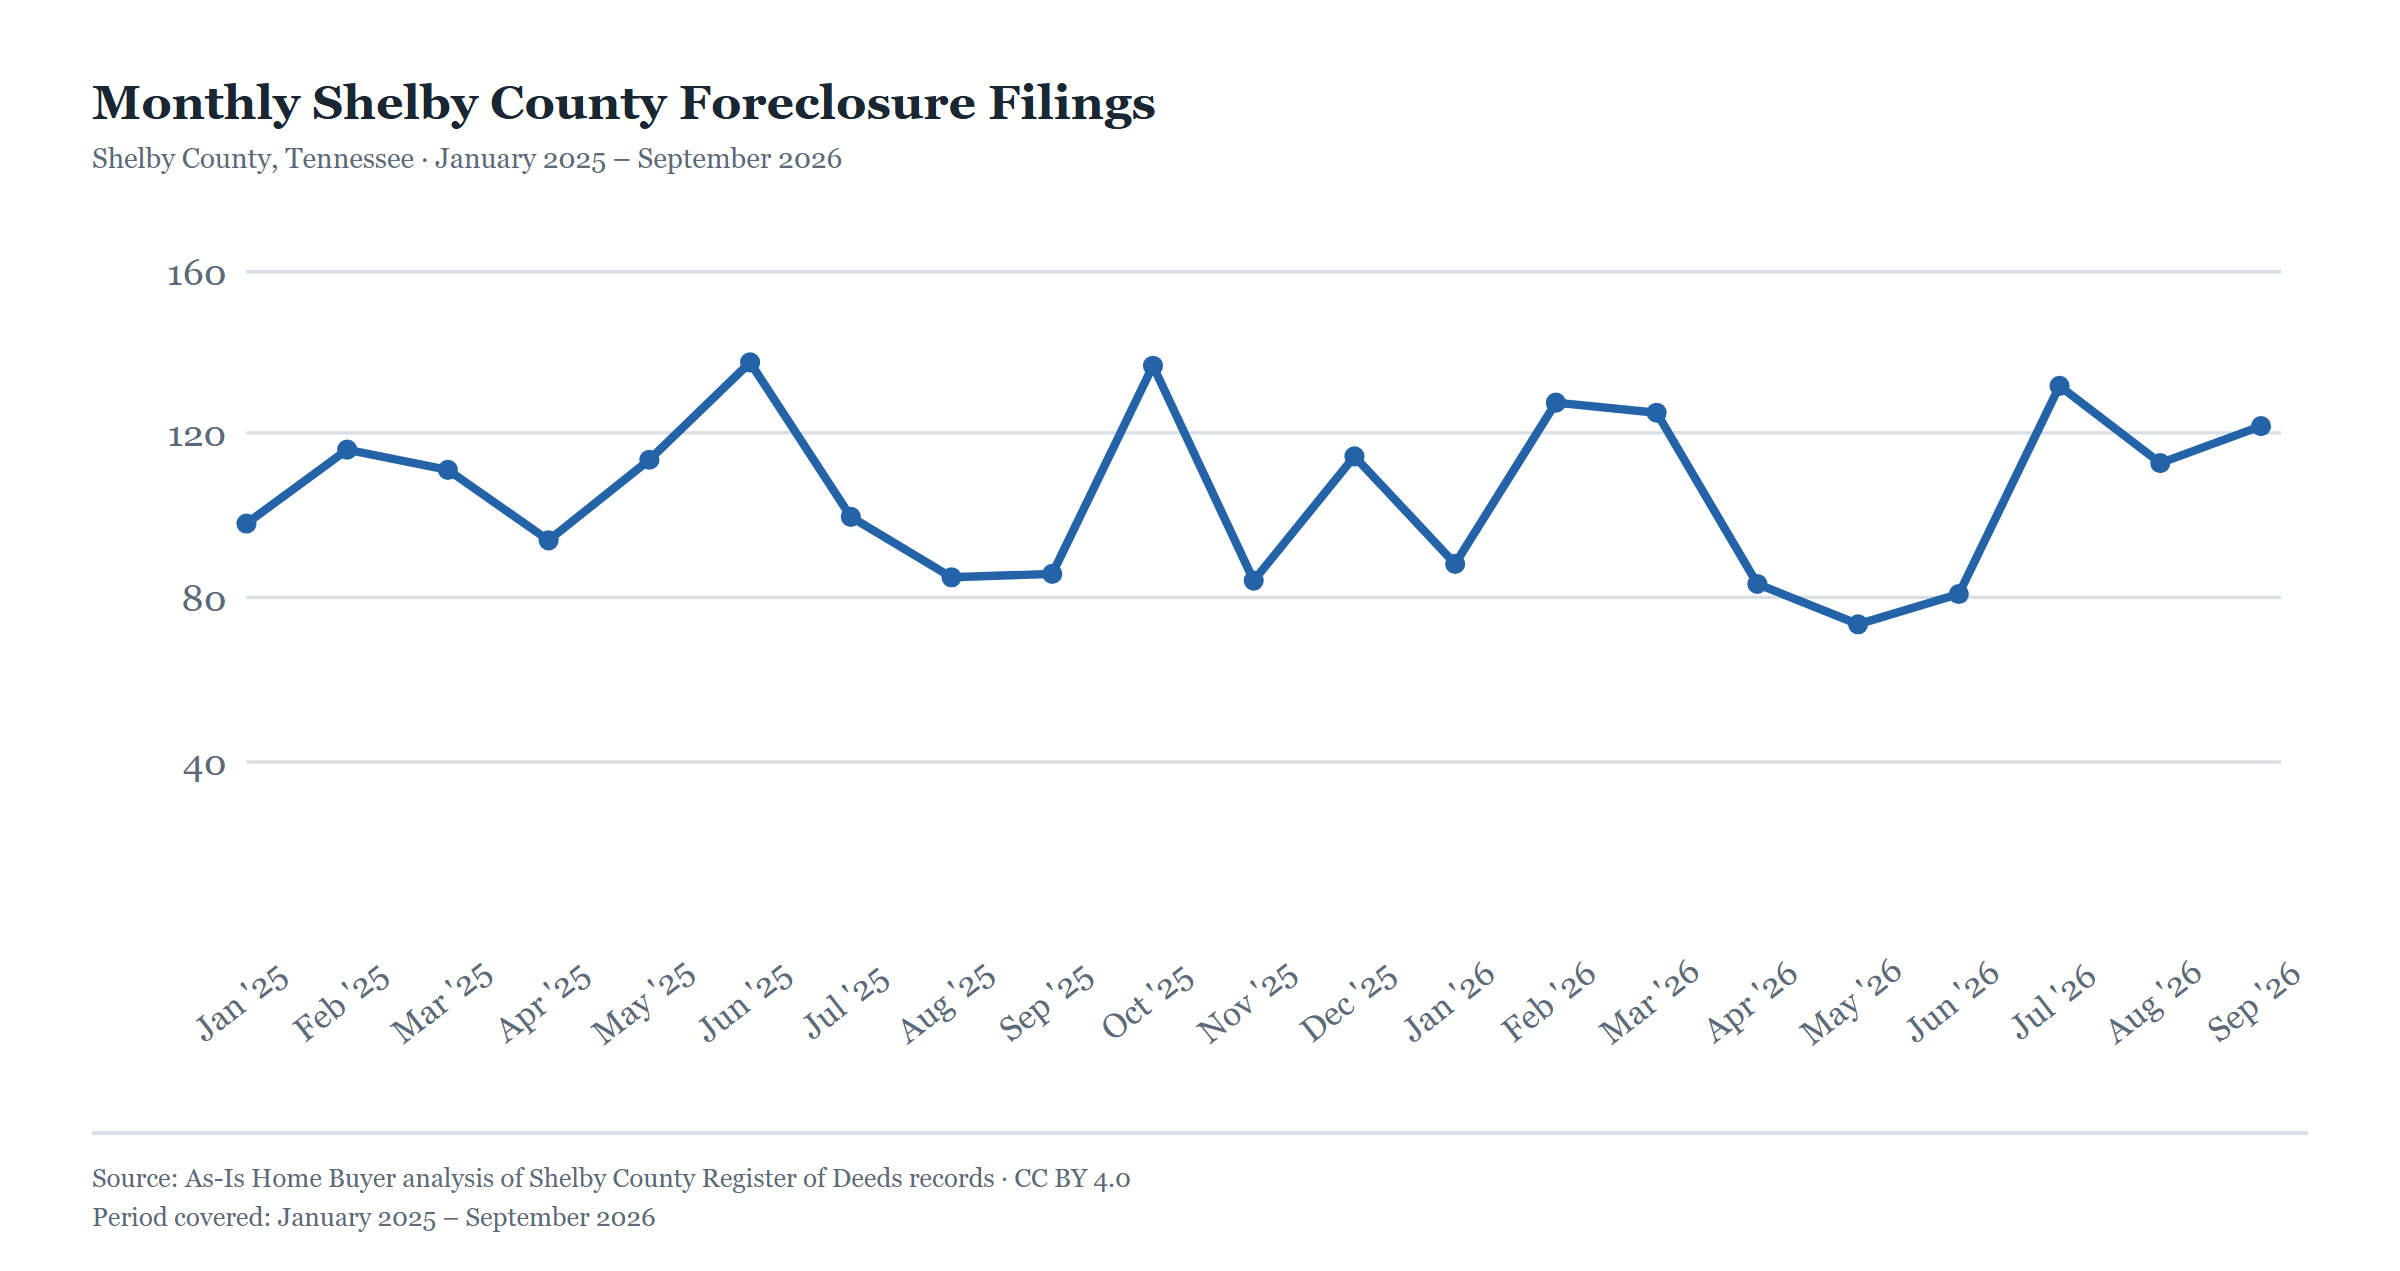
Shelby County recorded 367 new foreclosure filings in Q3 2026 (July–September) — up 35.4% from a year earlier and the most in any quarter since at least January 2025. The first nine months of 2026 produced 945 filings, against 1,278 in all of 2025 and 942 in the same nine months of 2025. A filing (an Appointment of Substitute Trustee) starts the process; it does not mean the home is lost.
How many Memphis homes are lost at foreclosure auction?
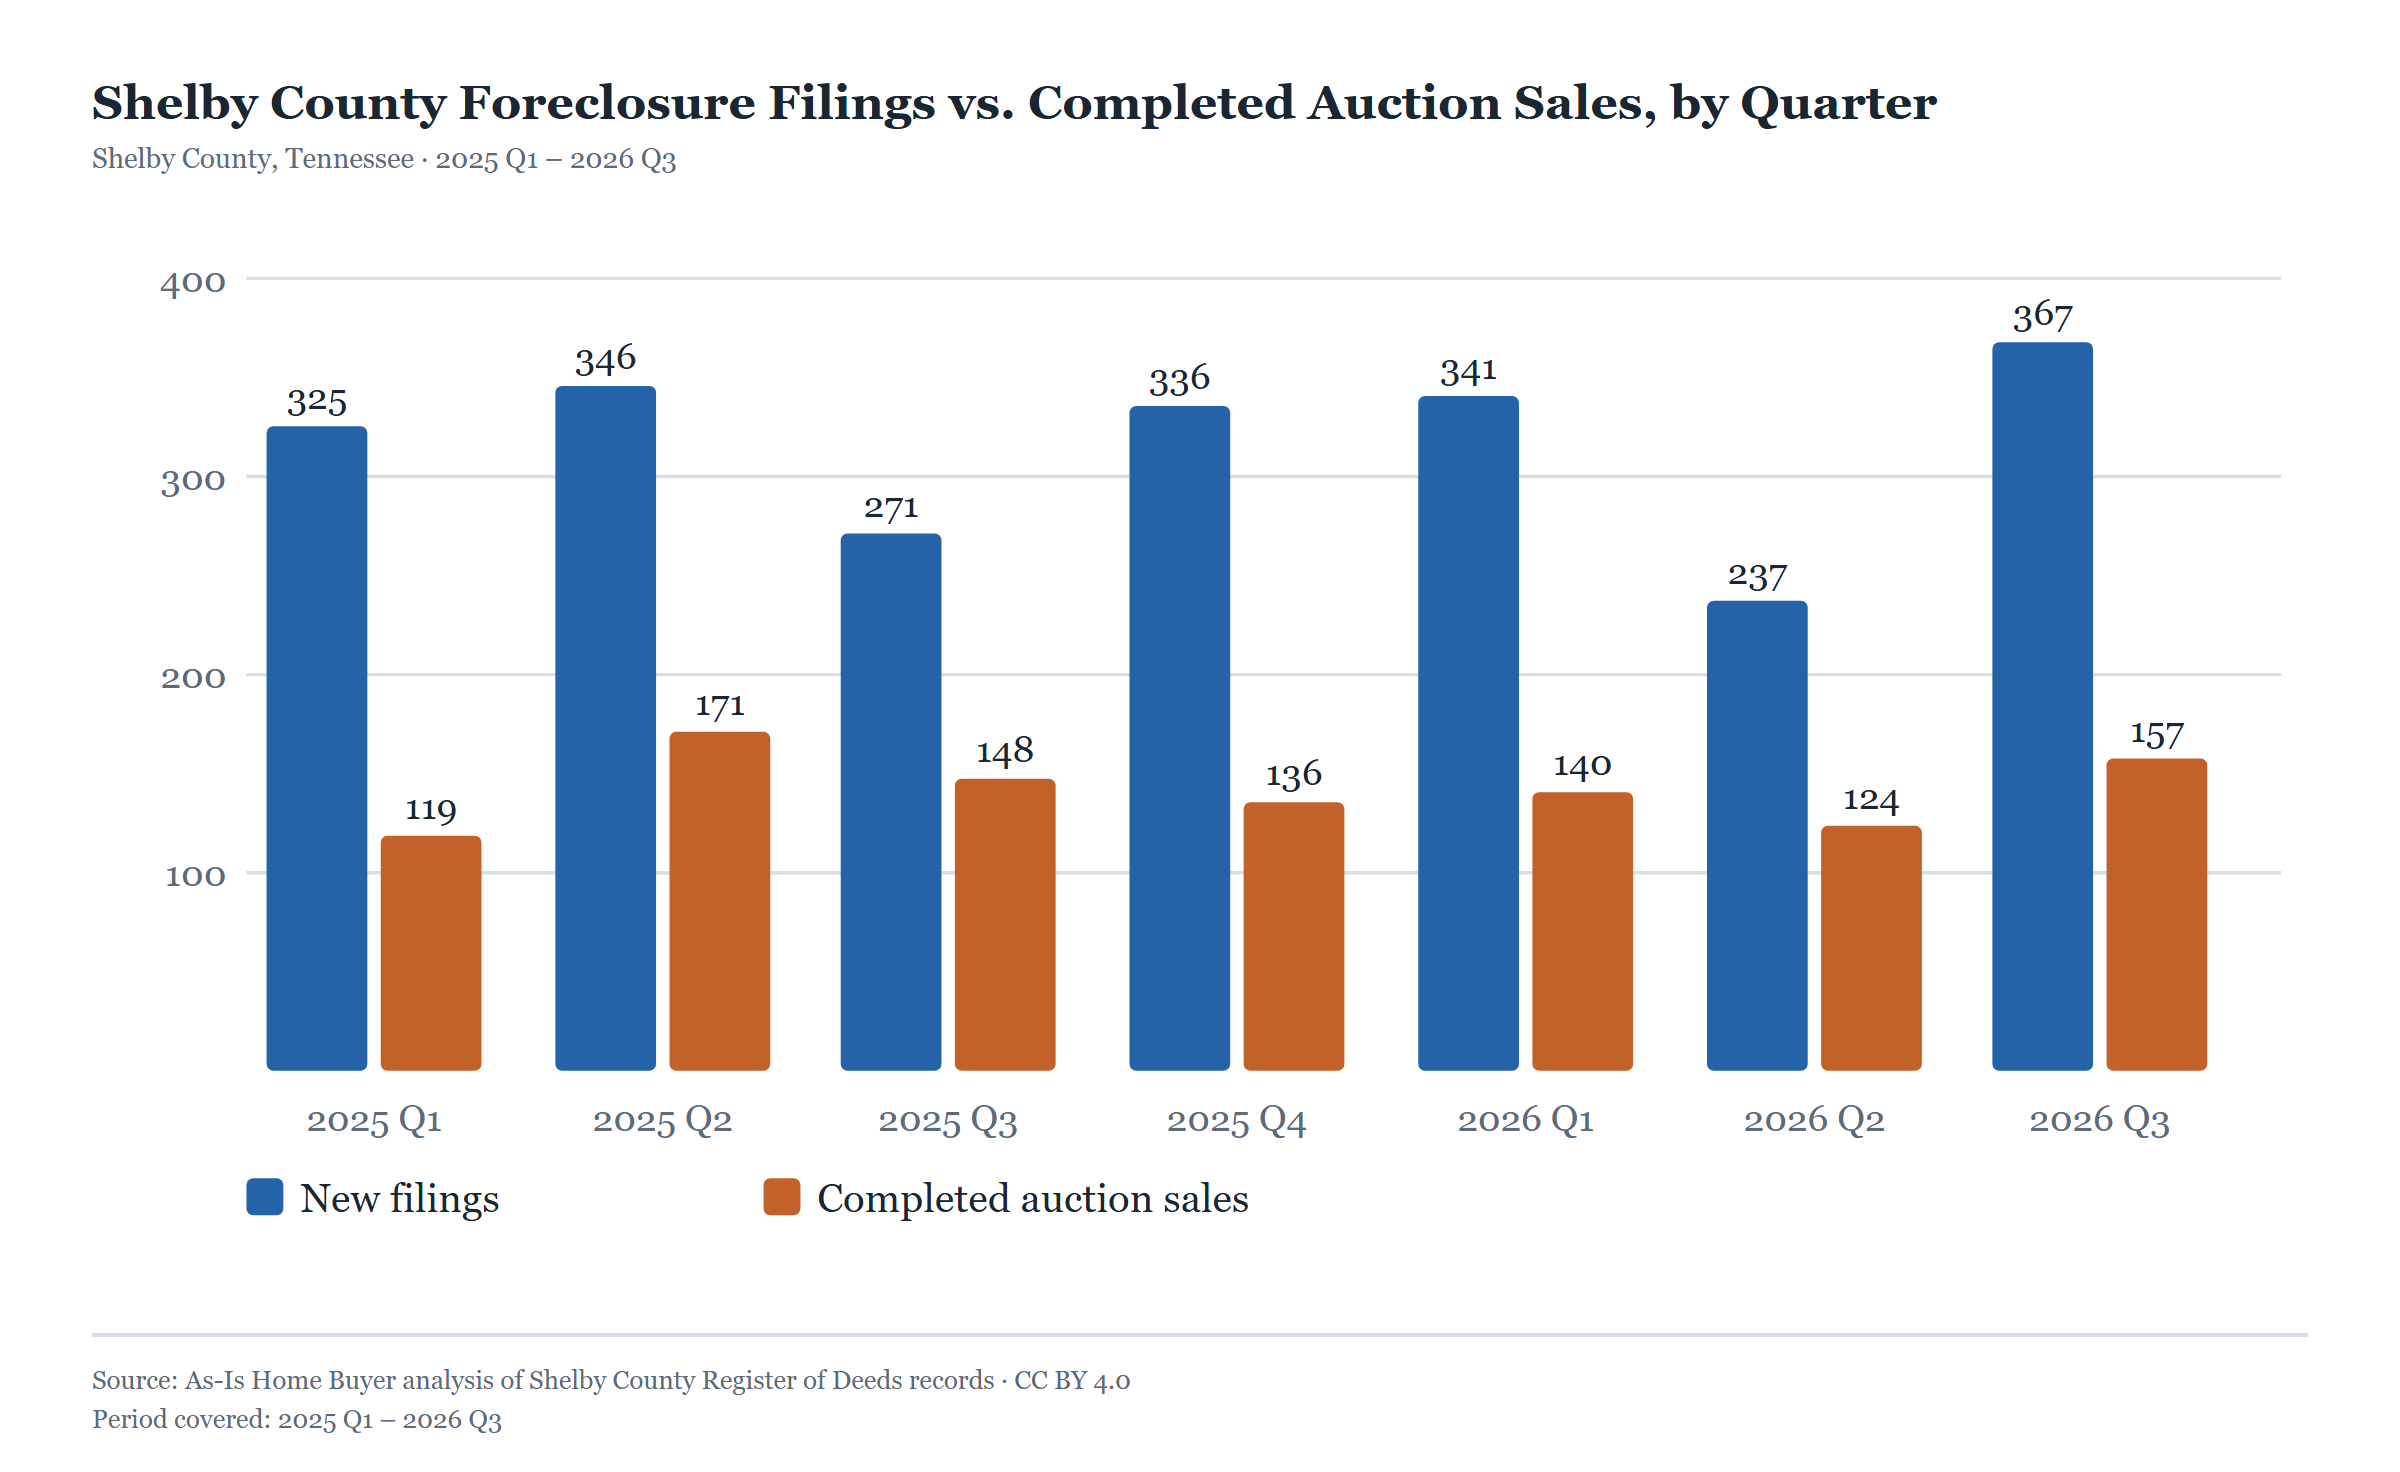
157 Shelby County homes completed foreclosure — sold at auction to a recorded Substitute Trustee’s Deed — in Q3 2026, up 26.6% from the prior quarter and 6.1% from a year earlier. 2025 saw 574 completed foreclosure sales; the first nine months of 2026 saw 421, against 438 in the same months of 2025.
| Quarter | New filings | Completed auction sales | Median completed-sale price |
|---|---|---|---|
| 2025 Q1 | 325 | 119 | — |
| 2025 Q2 | 346 | 171 | $123,011 |
| 2025 Q3 | 271 | 148 | $131,806 |
| 2025 Q4 | 336 | 136 | $121,000 |
| 2026 Q1 | 341 | 140 | $107,050 |
| 2026 Q2 | 237 | 124 | $121,001 |
| 2026 Q3 | 367 | 157 | $115,106 |
Records begin January 2025; the Q1 2025 median predates the published dataset window. Completed sales in a quarter stem from filings made in earlier quarters, and not every filing reaches sale — loans are reinstated, modified, or paid off.
Who buys foreclosed homes at Memphis auctions?
At Shelby County foreclosure auctions in Q3 2026, lender- or government-type holders took 80 of the 157 homes sold (51%) — the largest share in the five quarters tracked — investment entities bought 39 (25%), the smallest share in those quarters, and individuals bought 24 (15%). The buyer split is a name-based classification; see the quarterly report’s methodology for its limits.
| Quarter | Auction sales | Investment entities | Lender / government | Individuals | Ambiguous |
|---|---|---|---|---|---|
| 2025 Q3 | 148 | 77 (52%) | 56 | 10 | 5 |
| 2025 Q4 | 136 | 58 (43%) | 63 | 9 | 6 |
| 2026 Q1 | 140 | 61 (44%) | 60 | 15 | 4 |
| 2026 Q2 | 124 | 50 (40%) | 54 | 18 | 2 |
| 2026 Q3 | 157 | 39 (25%) | 80 | 24 | 14 |
Classification of grantee names on Substitute Trustee’s Deeds; see the methodology for the rules and their limits. Q4 2025 shows 136 sales, one more than earlier editions printed, after the Register added one December 2025 deed to its index, and Q1 2025 shows 119 sales, one fewer than the Q2 edition printed (that edition counted a null-dated record).
What does a foreclosed Memphis home sell for?
The median completed foreclosure sale in Shelby County was $115,106 in Q3 2026 (across the 138 of 157 deeds recording a price) — about 61% of the typical Memphis home sale of about $187,000 (Redfin, three months ending August 2026).
Which Memphis ZIP codes have the most foreclosures?
Frayser’s 38127 recorded the most new foreclosure filings of any Memphis-area ZIP code in Q3 2026 (15), followed by Southeast Memphis’s 38125 (13), while 38109 in Southwest Memphis closed the most foreclosure auction sales (14).
| ZIP | New filings (Q3 2026) | Completed sales (Q3 2026) |
|---|---|---|
| 38127 | 15 | 10 |
| 38125 | 13 | 3 |
| 38109 | 12 | 14 |
| 38111 | 11 | 10 |
| 38119 | 10 | 4 |
| 38002 | 9 | 3 |
| 38016 | 9 | 7 |
| 38114 | 9 | 7 |
| 38134 | 9 | 5 |
| 38116 | 8 | 8 |
Top 10 by new filings among records with a resolvable property address (ties broken by ZIP number; 38116, 38122 and 38135 tie at 8 for the last place) (194 of 367 filings and 144 of 157 sales resolved in Q3 2026). Raw counts, not rates — larger ZIPs have more homes. The full ZIP table is in the quarterly report.
Which firms run Shelby County foreclosures?
The five busiest substitute-trustee firms were named in 45% of Shelby County’s 367 foreclosure filings in Q3 2026, led by Foundation Legal Group with 41. The substitute trustee is chosen by the lender or its servicer, not the borrower.
| Substitute-trustee firm | Appointments (Q3 2026) |
|---|---|
| Foundation Legal Group | 41 |
| Rubin Lublin TN | 36 |
| Padgett Law Group | 31 |
| LLG Trustee TN | 28 |
| Clear Recon | 28 |
| Nestor Solutions of Tennessee | 20 |
| Albertelli Law | 18 |
| Robertson Anschutz Schneid Crane | 18 |
How many Shelby County properties face tax sale?
As of October 5, 2026, 1,266 Shelby County parcels sat on the County Trustee’s tax-sale list for delinquent property taxes, all of them assigned to Tax Sale 2302, scheduled for April 13, 2027. Tax Sale 2301, scheduled for October 27, 2026, was advertised August 26, 2026 and is no longer in that list. Tax sale is a separate process from mortgage foreclosure.
Source: the County Trustee’s published tax-sale schedule and parcel list, a point-in-time inventory.
The quarterly reports behind this page
- Shelby County Foreclosure Report — Q3 2026 (current edition, published October 2026)
- Shelby County Foreclosure Report — Q2 2026 (published July 2026)
- Shelby County Foreclosure Report — Q1 2026 (published June 2026)
Each edition carries the full findings, charts, methodology, and caveats for its quarter. The next edition (Q4 2026) publishes the first week of January 2027.
Cite or reuse these statistics
The statistics, tables, and charts on this page are free to republish — in news stories, research, classrooms, or on the web, including commercially. The only condition is attribution with a link to this page. Suggested citation:
As-Is Home Buyer, “Memphis & Shelby County Foreclosure Statistics,” updated October 2026, https://shelby.as-ishomebuyer.com/post/shelby-county-foreclosure-statistics
To link this page on the web:
<a href="https://shelby.as-ishomebuyer.com/post/shelby-county-foreclosure-statistics">Memphis & Shelby County Foreclosure Statistics</a>
These reuse terms are the Creative Commons Attribution 4.0 license (CC BY 4.0). Every section has a stable anchor for deep links (for example #buyers or #tax-sale).
Download the data
The full aggregate dataset comes as one CSV: quarterly filings, completions, and median prices for the five quarters through Q3 2026, monthly initiation counts back to January 2025, the auction-buyer classification, ZIP-level counts, trustee-firm appointments, and repeat-buyer purchases. No sign-up, no individual homeowner information.
Download the aggregate dataset (CSV)
Same license: use it freely, link this page as the source. Need a cut that isn’t in the file? (901) 763-6616.
Use these charts
The 3 charts on this page are also free to reuse as standalone images — same CC BY 4.0 terms as the rest of this page: attribution with a link back here. Download the PNG or copy the embed code below to drop a chart into your own page, story, or slide deck.
Methodology in brief
Foreclosure filings are documents indexed as “Appointment of Substitute TR” and completed sales are “Sub Trustees Deeds,” both from the Shelby County Register of Deeds public index (search.register.shelby.tn.us), by recording date, deduplicated by instrument number. Medians are computed over deeds recording a consideration amount. Buyer categories classify grantee names (corporate markers = investment entities; bank/servicer/government identifiers = lender-side; personal names = individuals). Tax-sale inventory is the County Trustee’s published extract. Samples are hand-checked against the Register’s records each quarter. The full methodology, caveats, and hand-check results are in the current quarterly report. Counts reflect documents as indexed and may differ from measures based on auctions scheduled or notices published. This page contains aggregate statistics only; no individual homeowner information.
If you are facing foreclosure: free HUD-approved housing counseling is available through the Homeowner’s HOPE Hotline at 888-995-4673, and a foreclosure filing does not mean the home is already lost — the Tennessee timeline and the steps that can stop a sale are laid out in how to stop a Memphis foreclosure, and selling a house in foreclosure before the auction date is one of those steps.
About this page. Maintained by As-Is Home Buyer, a home-buying company that purchases homes directly from Shelby County owners — including owners facing foreclosure — a commercial interest readers should weigh. The statistics are built solely from the public records described above. Analysis by Nick Hedberg. Questions about the data: (901) 763-6616 · shelby.as-ishomebuyer.com/memphis.